Page 62 -
P. 62

Notes to the Consolidated Financial Statements


               31st March 2015


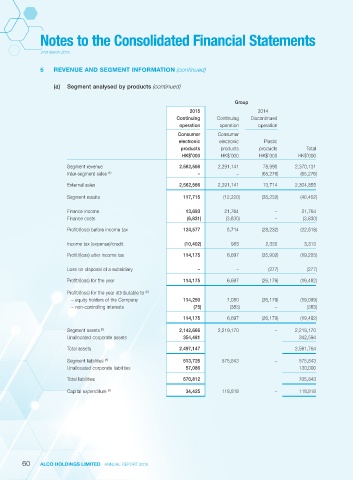
               5   REVENUE AND SEGMENT INFORMATION (continued)


                   (a)  Segment analysed by products (continued)

                                                                                Group
                                                                 2015                   2014
                                                             Continuing   Continuing   Discontinued
                                                              operation    operation    operation
                                                             Consumer      Consumer
                                                             electronic    electronic     Plastic
                                                              products     products     products        Total
                                                              HK$’000      HK$’000      HK$’000       HK$’000
                        Segment revenue                      2,562,566     2,291,141      78,990     2,370,131
                        Inter-segment sales  (1)                    –            –       (65,276)     (65,276)
                        External sales                       2,562,566     2,291,141      13,714     2,304,855

                        Segment results                        117,715      (12,220)     (28,232)     (40,452)

                        Finance income                          13,693       21,764           –        21,764
                        Finance costs                           (6,831)      (3,830)          –        (3,830)

                        Profit/(loss) before income tax        124,577        5,714      (28,232)     (22,518)

                        Income tax (expense)/credit            (10,402)        983         2,330        3,313
                        Profit/(loss) after income tax         114,175        6,697      (25,902)     (19,205)

                        Loss on disposal of a subsidiary            –            –          (277)        (277)
                        Profit/(loss) for the year             114,175        6,697      (26,179)     (19,482)

                        Profit/(loss) for the year attributable to  (2)
                         – equity holders of the Company       114,250        7,080      (26,179)     (19,099)
                         – non-controlling interests              (75)         (383)          –          (383)
                                                               114,175        6,697      (26,179)     (19,482)

                        Segment assets  (3)                  2,142,666     2,219,170          –      2,219,170
                        Unallocated corporate assets           354,481                                342,594

                        Total assets                         2,497,147                               2,561,764
                        Segment liabilities  (4)               513,726      575,843           –       575,843
                        Unallocated corporate liabilities       57,086                                130,000
                        Total liabilities                      570,812                                705,843

                        Capital expenditure  (5)                34,425      118,818           –       118,818


         60    ALCO HOLDINGS LIMITED  ANNUAL REPORT 2015
   57   58   59   60   61   62   63   64   65   66   67